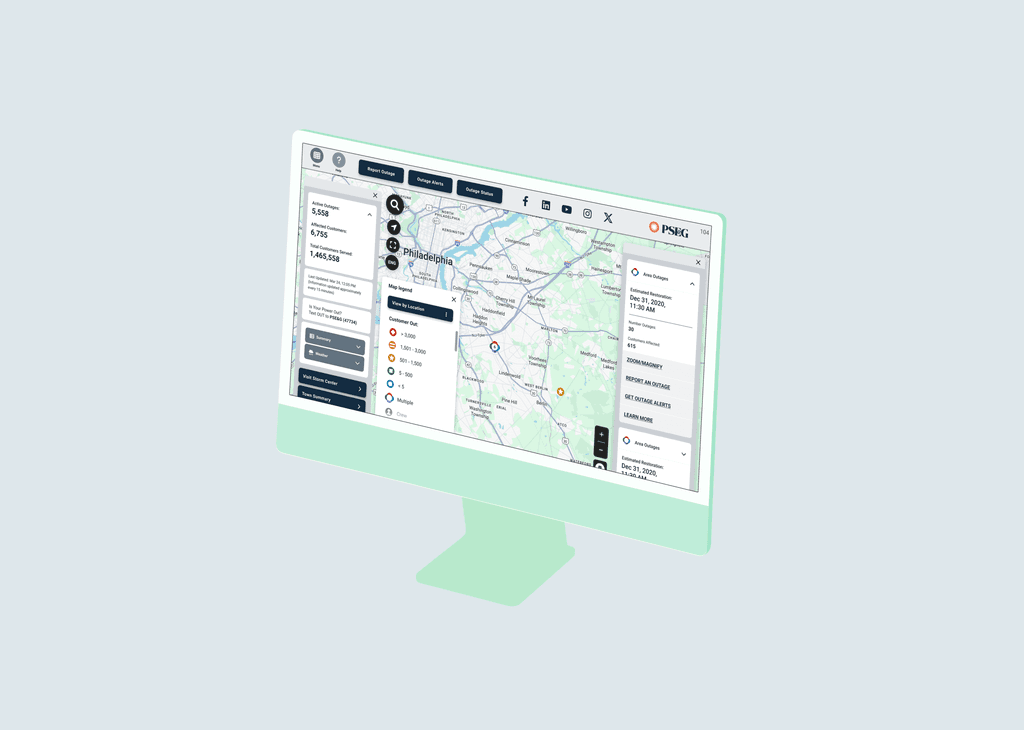
Storm Center is a public-facing experience for PSE&G New Jersey that helps customers stay informed during power outages, especially during storms and severe weather. The outage map is a key part of this experience, giving users real-time visibility into outage locations, how many customers are affected, and estimated restoration times. I worked on the outage map redesign with a focus on making complex outage data easier to understand at a glance. During stressful situations, customers need answers quickly, often on their phones, and without having to dig. My role was to help shape an experience that feels clear, reliable, and easy to use across devices, while supporting high traffic and time-sensitive information.

YEAR
2026
ROLE
Lead UX/UI Designer
SERVICES
UI Design
UX Design
About the project
Goal
The goal of the Storm Center outage map was to help customers quickly understand what is happening and what to expect during a power outage. The design needed to reduce confusion and stress by presenting accurate information in a way that feels calm and easy to scan.
From a design standpoint, the goal was to improve information hierarchy, make key details easier to find, and ensure the experience worked well on both mobile and desktop. The outage map needed to scale from everyday outages to major storm events, while remaining accessible and intuitive for a wide range of users.
At its core, the goal was to create a dependable experience that customers could trust when they need information the most.
VIEW LIVE SITE


Smooth Scroll
This will hide itself!
This will hide itself!
Storm Center (PSEGNJ)
OVERVIEW
Storm Center is a public-facing experience for PSE&G New Jersey that helps customers stay informed during power outages, especially during storms and severe weather. The outage map is a key part of this experience, giving users real-time visibility into outage locations, how many customers are affected, and estimated restoration times. I worked on the outage map redesign with a focus on making complex outage data easier to understand at a glance. During stressful situations, customers need answers quickly, often on their phones, and without having to dig. My role was to help shape an experience that feels clear, reliable, and easy to use across devices, while supporting high traffic and time-sensitive information.
VIEW XD PROTOTYPE
YEAR
2026
ROLE
Lead UX/UI Designer
SERVICES
UI Design
UX Design
About the project
Goal
The goal of the Storm Center outage map was to help customers quickly understand what is happening and what to expect during a power outage. The design needed to reduce confusion and stress by presenting accurate information in a way that feels calm and easy to scan.
From a design standpoint, the goal was to improve information hierarchy, make key details easier to find, and ensure the experience worked well on both mobile and desktop. The outage map needed to scale from everyday outages to major storm events, while remaining accessible and intuitive for a wide range of users.
At its core, the goal was to create a dependable experience that customers could trust when they need information the most.
VIEW LIVE SITE
Smooth Scroll
This will hide itself!
This will hide itself!